Choropleth Map - Candidate Financial Strength
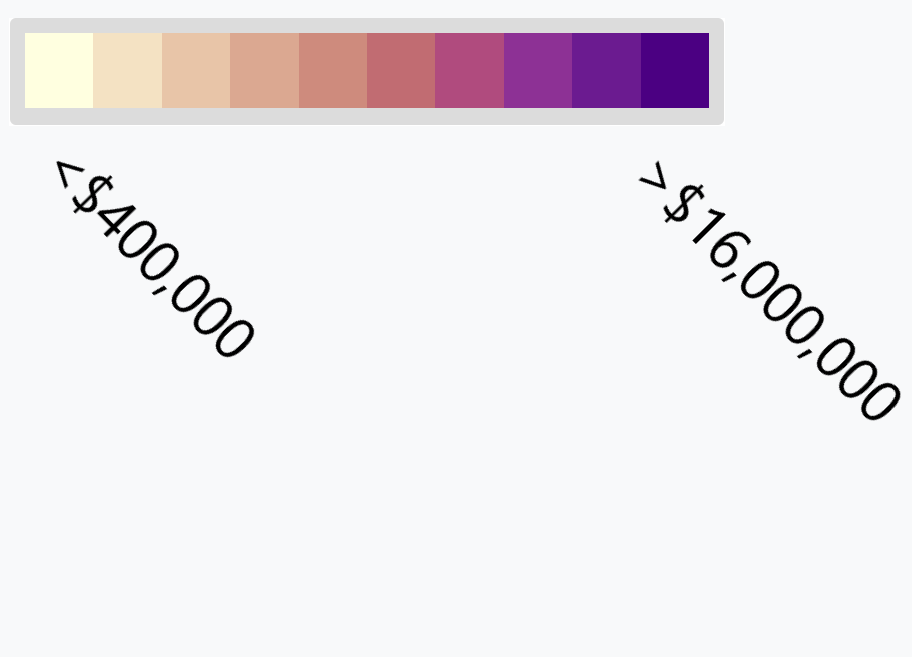
This project aims to create visualizations that portray data from 2018 Congressional Election. The first map shows the winning candidates’ party, state, and district. The second and third maps are choropleths that reflects employment rate in each district based on US Census Bureau data, and each winning candidate’s total receipts, i.e. the total funds they raised, as reported by the FEC.